A program written for the lecture
Informations visualisation (summer term 2004)
Michael Wohlfahrt, 9825026
Jürgen Platzer, 0025360
| Functionality of the program » |
Description of the ThemeRiver
The ThemeRiver (also known as StreamGraph) is a visualization method helping to detect trends,
patterns in the appearance or the absence of categorical data, so called
themes. It can be used to picture data that is changing over time. The following
example demonstrates the concept of the ThemeRiver.
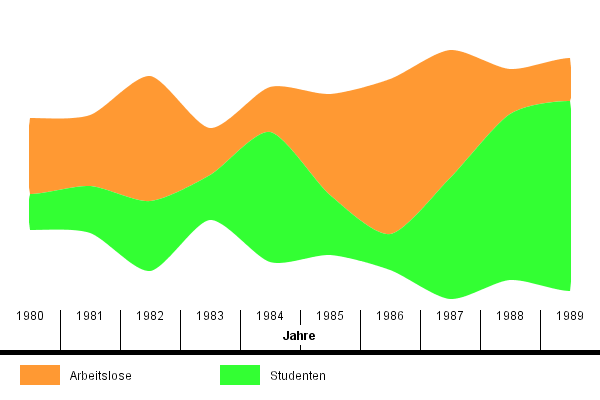
In the following picture an invented dataset that compares the number of
unemployed people with the number of students over time is used.

Picture 1: ThemeRiver - artificial data: Unemployed and students
In this visualization the colored areas represent the categorial data (e.g.
unemployed) over a period of time. The user can easily detect when a
theme is strongly represented by watching at the width of an river at a point in time.
(For example unemployed in the year 1986.) Also patterns or correlations of themes
over time can be
detected in that way. If a theme is not given in a point of time, its river disappears.
A detailed description of the ThemeRiver can be read in the following papers:
-
Susan Havre, Beth Hetzler, and Lucy Nowell.
ThemeRiver: In Search of Trends, Patterns and Relationships, 1999
Download links on Google Scholar -
Susan Havre, Elizabeth Hetzler, Paul Whitney, Lucy Nowell.
ThemeRiver: Visualizing Thematic Changes in Large Document Collections, 2002
Download links on Google Scholar
| Functionality of the program » |