A program written for the lecture
Informations visualisation (summer term 2004)
Michael Wohlfahrt, 9825026
Jürgen Platzer, 0025360
| « Functionality of the program | Possible new features » |
Visualization examples
The following image are examples that show the capabilities of the application.
The first visualization shows a ThemeRiver with a linear interpolation in the background.
The artificial dataset has avlue range, which is strongly descending.
A magic lens is used to show the histogram mode of the dataset applying
a different interpolation mode. So it is possible to see also data where the value ranges are to low
for the normal ThemeRiver visualization.
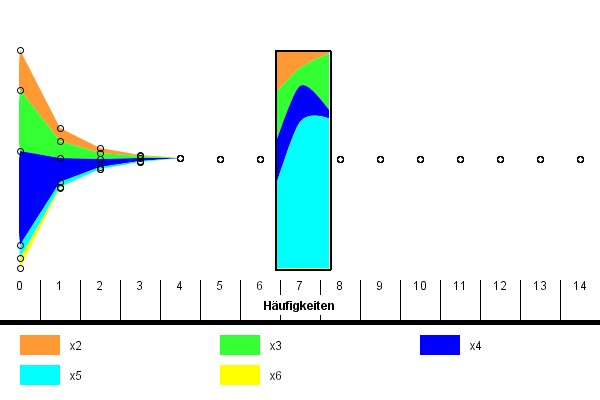
Picture 3: Example 1
In the second example a histogram visualization of the same dataset is shown. Percentage values are displayed.
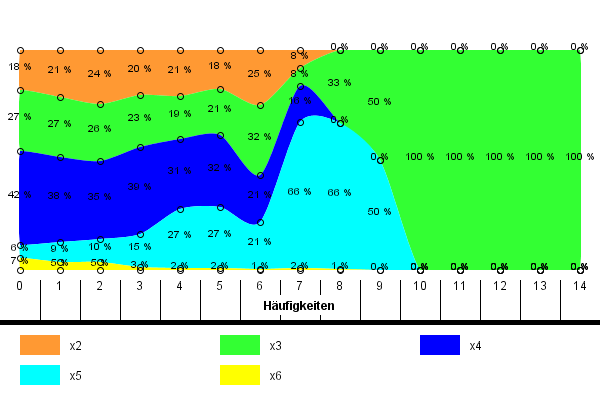
Picture 4: Example 2
A magic lens visualizes the differences between two interpolation techniques in the final example.
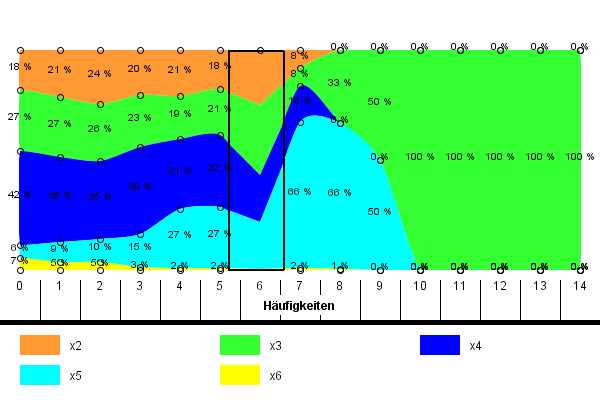
Picture 5: Example 3
| « Functionality of the program | Possible new features » |